At Future Heirlooms, we’ve taken climate data collection to another level, and started using a digital data logger called Sensor Push which records temperature and humidity every 60 seconds 24/7 - 365 days a year! The data is displayed in a graph on our smart devices for live viewing, and also supports export in to spreadsheets for a more detailed analysis.
We now can very easily keep track of not only the highs and lows of the day, but also the peaks and valleys throughout the day, and for how long we maintain temperatures during the day and at night. For example, our Min/Max thermometer tells us we reached 35c, but doesn’t tell us anything about how hot the day was overall. Our Sensor Push device will show us we maintained 30c+ for 5 hours with the peak reaching 35c for 1 hour, and in addition it tells us when it was most warm during the day which helps us plan watering, transplanting, and other garden tasks we may want to complete before the peak heat of the day.
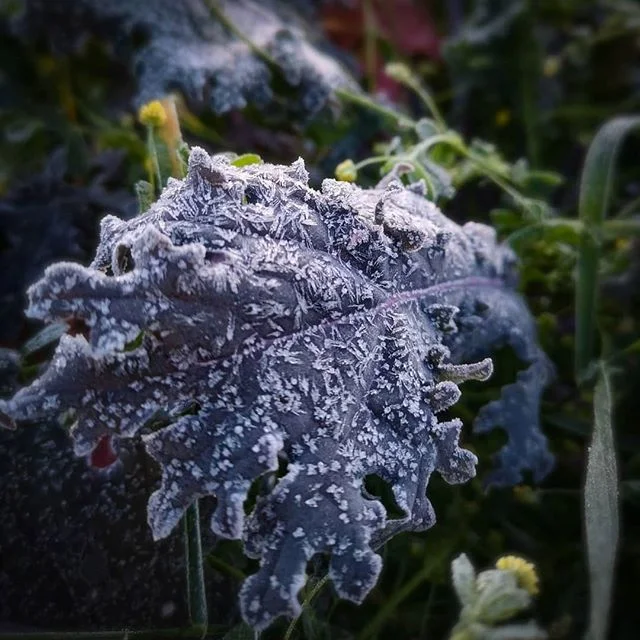
Why is this level of detail important? Let’s say we head out to the garden and see frost, which would indicate we are close to freezing, but we want to know how long we were at this low temperature. The data logger will show us when the temperature dipped below 5c and show us how long we maintained this temperature. There is a big difference between a quick dip below zero and some light frost at 6am, versus a drop below zero at midnight and a sustained freeze for 6 hours. Potatoes would show frost damage from sustained freezing, yet would be perfectly fine with a temporary light frost. Or perhaps we saw no frost at all because we didn’t reach the garden before sunshine melted it; our data would show we dropped below zero and we could safely assume we did have a light frost.
Observation and experience in the garden is one of the most important factors in learning a micro-climate, however we can use technology to observe the things we aren’t able to see or that we aren’t present to observe first hand.